30-årsnormal og sammenlikninger med DNMIs målinger
Værstasjonen i Voksenlia ligger ikke langt fra DNMIs målestasjoner,
nær 2 km sørvest for stasjonen på Tryvannshøgda ("Tryvasshøgda" før
2012) og om lag 5 km nordvest
for Blindern. Høgde over havet for stasjonene er 94, 349 og 514 meter
for hhv. Blindern, Voksenlia og Tryvannshøgda. Temperaturen i
Voksenlia skal dermed i utgangspunktet ligge på et punkt mellom
temperaturene på Blindern og Tryvannshøgda som tilsvarer høgdeforskjellene:
TV = ((349-94)/(514-94))·TT +
((514-349)/(514-94))·TB = 0,607·TT +
0,393·TB,
der TV, TT og TB er temperaturene for hhv. Voksenlia, Tryvannshøgda og Blindern.
Sjøl om stasjonene ikke ligger langt fra hverandre, vil det være visse lokale forskjeller. Men disse viskes for det meste ut om en sammenlikner middeltemperaturene over en lengre periode, for eksempel en måned. Forskjellene på et gitt tidspunkt kan variere mye; f.eks. ligger Voksenlia liksom Tryvannshøgda normalt over inversjonsnivået i kaldt vintervær, og Blindern kan under slike forhold ha en vesentlig lavere temperatur enn både Voksenlia og Tryvannshøgda. Andre spesielle forhold for Voksenlia er kjølige formiddager ettersom sola ikke dukker opp før langt ute på formiddagen, mens kveldssola vil varme helt til solnedgang. Dessuten hindrer det bratte terrenget kaldt luft å legge seg i klart vær om natta, og nettene blir sjelden svært kalde.
| 
Tryvannshøgda 31. januar 2004. |
Følgende tabeller viser observerte månedsverdier (°C) for 2004. Verdiene for Voksenlia følger her DNMIs temperatur- og nedbørsdøgn, slik at samme perioder sammenliknes. Andre oversikter på voksenlia.net deler alle døgn ved 00:00 UTC.
| Middeltemperatur | jan | feb | mar | apr | mai | jun | jul | aug | sep | okt | nov | des | 2004 |
| Blindern | -3,8 | -1,5 | +2,0 | +7,4 | +12,5 | +14,2 | +16,0 | +17,9 | +12,3 | +6,5 | +1,0 | +0,3 | +7,1 |
| Voksenlia | -5,01) | -2,0 | +0,4 | +5,5 | +10,6 | +12,3 | +14,0 | +16,1 | +11,1 | +4,9 | +0,3 | +0,0 | +5,71) |
| Tryvasshøgda | -6,2 | -2,1 | -0,6 | +3,9 | +9,0 | +10,6 | +12,5 | +14,5 | +9,6 | +3,5 | -1,0 | -0,7 | +4,4 |
| Middeltemperatur | jan | feb | mar | apr | mai | jun | jul | aug | sep | okt | nov | des | 2005 |
| Blindern | +1,7 | -0,9 | -0,8 | +7,0 | +9,7 | +14,5 | +18,8 | +15,9 | +12,5 | +7,5 | +4,4 | -1,1 | +7,4 |
| Voksenlia | +0,4 | -2,5 | -1,7 | +5,2 | +7,6 | +12,3 | +16,8 | +13,9 | +11,1 | +6,3 | +3,0 | -1,9 | +5,7 |
| Tryvasshøgda | -0,8 | -3,8 | -2,5 | +3,9 | +6,2 | +10,9 | +15,4 | +12,4 | +9,5 | +5,5 | +1,8 | -2,8 | +4,7 |
| Middeltemperatur | jan | feb | mar | apr | mai | jun | jul | aug | sep | okt | nov | des | 2006 |
| Blindern | -2,4 | -3,2 | -3,3 | +4,6 | +12,0 | +16,0 | +20,0 | +18,1 | +15,0 | +8,5 | +4,1 | +2,4 | +7,7 |
| Voksenlia | -3,1 | -3,1 | -4,1 | +2,5 | +9,8 | +13,6 | +17,9 | +16,2 | +13,1 | +6,6 | +3,3 | +3,1 | +6,4 |
| Tryvasshøgda | -4,0 | -4,0 | -5,3 | +1,4 | +8,5 | +12,7 | +16,7 | +14,9 | +11,9 | +5,8 | +2,1 | +2,4 | +5,3 |
| Middeltemperatur | jan | feb | mar | apr | mai | jun | jul | aug | sep | okt | nov | des | 2007 |
| Blindern | -0,9 | -3,2 | +4,2 | +5,0 | +10,9 | +17,0 | +16,1 | +16,5 | +11,0 | +6,9 | +1,5 | -1,4 | |
| Voksenlia | -1,1 | -4,6 | +3,2 | +6,0 | +8,7 | +15,3 | +14,0 | +14,6 | +9,3 | +5,8 | +0,9 | -1,5 | +5,5 |
| Tryvasshøgda | -2,2 | -5,8 | +2,1 | +7,6 | +7,6 | +14,2 | +12,8 | +13,4 | +8,4 | +5,0 | -0,3 | -1,1 | |
| Middeltemperatur | jan | feb | mar | apr | mai | jun | jul | aug | sep | okt | nov | des | 2008 |
| Blindern | +0,9 | +1,9 | +0,9 | +6,7 | +12,3 | +15,8 | +18,3 | +15,2 | +10,8 | +6,8 | +2,1 | -1,2 | +7,5 |
| Voksenlia | -0,5 | +0,9 | -0,7 | +5,1 | +11,0 | +13,9 | +16,8 | +13,6 | +9,4 | +5,9 | +1,7 | -1,8 | +6,3 |
| Tryvasshøgda | -1,5 | -0,3 | -2,2 | +3,6 | +9,7 | +12,6 | +15,6 | +12,1 | +8,0 | +4,4 | +0,5 | -2,7 | +5,0 |
| Middeltemperatur | jan | feb | mar | apr | mai | jun | jul | aug | sep | okt | nov | des | 2009 |
| Blindern | -2,2 | -5,1 | +1,2 | +7,7 | +12,0 | +15,8 | +17,3 | +16,1 | +12,9 | +4,4 | +3,9 | -3,8 | |
| Voksenlia | -2,7 | -5,2 | -0,4 | +6,4 | +9,9 | +13,8 | +15,1 | +14,0 | +11,4 | +3,3 | +2,1 | -4,4 | +5,4 |
| Tryvasshøgda | -3,9 | -6,1 | -1,5 | +5,6 | +8,6 | +12,4 | +13,7 | +12,8 | +10,0 | +2,0 | +0,7 | -5,5 | |
| Middeltemperatur | jan | feb | mar | apr | mai | jun | jul | aug | sep | okt | nov | des | 2010 |
| Blindern | -8,1 | -6,3 | +0,3 | +6,0 | +11,0 | +15,3 | +18,0 | +16,1 | +11,3 | +5,7 | -2,0 | -9,2 | |
| Voksenlia | -7,5 | -6,9 | -0,6 | +4,2 | +8,8 | +13,0 | +15,5 | +14,1 | +9,7 | +4,6 | -3,3 | -8,7 | +3,6 |
| Tryvasshøgda | -8,6 | -8,1 | -1,4 | +2,9 | +7,4 | +11,5 | +14,1 | +12,7 | +8,4 | +3,3 | -4,9 | -9,5 | |
| Middeltemperatur | jan | feb | mar | apr | mai | jun | jul | aug | sep | okt | nov | des | 2011 |
| Blindern | -3,5 | -4,9 | +0,6 | +9,3 | +11,3 | +15,9 | +18,0 | +16,1 | +12,7 | +7,6 | +4,6 | +0,8 | |
| Voksenlia | -2,7 | -5,7 | -0,8 | +8,0 | +9,2 | +13,7 | +15,8 | +14,2 | +11,1 | +6,5 | +3,7 | -0,1 | +6,1 |
| Tryvasshøgda | -3,6 | -6,8 | -1,7 | +7,1 | +7,8 | +12,5 | +14,5 | +12,9 | +10,0 | +5,2 | +3,0 | -1,5 | |
| Middeltemperatur | jan | feb | mar | apr | mai | jun | jul | aug | sep | okt | nov | des | 2012 |
| Blindern | -2,4 | -2,2 | +5,6 | +4,9 | +12,3 | +13,7 | +16,4 | +16,1 | +11,1 | +5,2 | +3,2 | -5,1 | |
| Voksenlia | -3,2 | -3,1 | +4,6 | +2,9 | +10,3 | +11,3 | +14,1 | +14,1 | +9,5 | +3,8 | +1,7 | -6,4 | +5,0 |
| Tryvannshøgda | -4,3 | -4,0 | +3,4 | +1,4 | +8,9 | +10,0 | +12,9 | +12,9 | +8,2 | +2,6 | +0,6 | -7,5 | |
| Middeltemperatur | jan | feb | mar | apr | mai | jun | jul | aug | sep | okt | nov | des | 2013 |
| Blindern | -4,9 | -3,2 | -2,1 | +4,3 | +12,8 | +15,0 | +18,4 | +16,3 | +12,0 | +7,5 | +2,4 | +2,0 | |
| Voksenlia | -5,0 | -3,6 | -3,2 | +2,6 | +10,6 | +13,0 | +16,6 | +14,7 | +11,0 | +6,5 | +1,9 | +1,0 | +5,6 |
| Tryvannshøgda | -5,6 | -4,3 | -4,5 | +1,5 | +9,6 | +11,5 | +15,3 | +13,3 | +9,5 | +5,3 | +0,8 | +0,1 | |
| Middeltemperatur | jan | feb | mar | apr | mai | jun | jul | aug | sep | okt | nov | des | 2014 |
| Blindern | -2,6 | +1,9 | +1,6 | +7,7 | +12,0 | +15,7 | +20,8 | +15,8 | +13,1 | +8,9 | +4,1 | -2,2 | |
| Voksenlia | -4,5 | -0,0 | +3,0 | +6,5 | +10,0 | +14,0 | +19,3 | +14,2 | +12,2 | +7,5 | +2,5 | -1,6 | |
| Tryvannshøgda | -5,9 | -1,0 | +4,3 | +5,2 | +8,8 | +12,5 | +18,0 | +12,6 | +10,7 | +6,2 | +1,2 | -2,2 | |
| Middeltemperatur | jan | feb | mar | apr | mai | jun | jul | aug | sep | okt | nov | des | 2015 |
| Blindern | -0,3 | +0,3 | +3,5 | +7,1 | +9,0 | +14,2 | +16,2 | +16,5 | +12,5 | +7,2 | +3,0 | +2,1 | |
| Voksenlia | -1,3 | -0,6 | +2,0 | +5,4 | +7,0 | +12,1 | +14,2 | +15,1 | +11,2 | +6,5 | +2,6 | +1,3 | +6,4 |
| Tryvannshøgda | -2,4 | -1,5 | +0,8 | +4,1 | +5,7 | +10,9 | +12,9 | +13,8 | +9,9 | +5,3 | +1,7 | +0,3 | |
| Middeltemperatur | jan | feb | mar | apr | mai | jun | jul | aug | sep | okt | nov | des | 2016 |
| Blindern | -5,5 | -0,7 | +3,1 | +5,9 | +12,3 | +16,7 | +17,2 | +15,5 | +15,0 | +6,1 | +0,7 | +0,9 | |
| Voksenlia | -5,7 | -1,5 | +2,0 | +4,2 | +10,6 | +14,9 | +15,3 | +13,8 | +13,7 | +4,6 | -0,3 | +1,1 | |
| Tryvannshøgda | -7,0 | -2,7 | +1,0 | +2,8 | +9,5 | +13,5 | +14,0 | +12,6 | +12,2 | - | - | +0,6 | |
| Middeltemperatur | jan | feb | mar | apr | mai | jun | jul | aug | sep | okt | nov | des | 2017 |
| Blindern | -1,4 | -1,5 | +2,6 | +5,2 | +11,6 | +15,1 | +16,9 | +15,3 | +12,2 | +7,2 | +1,6 | -1,5 | |
| Voksenlia | -1,2 | -2,5 | +1,2 | +3,6 | +10,0 | +12,9 | +14,9 | +13,3 | +10,4 | +6,1 | +0,9 | -1,3 | +5,8 |
| Tryvannshøgda | -1,8 | -2,9 | +0,1 | +2,4 | +9,0 | +11,9 | +13,7 | +12,2 | +9,0 | +4,9 | -0,2 | -2,0 | |
| Middeltemperatur | jan | feb | mar | apr | mai | jun | jul | aug | sep | okt | nov | des | 2018 |
| Blindern | -1,7 | -4,1 | -2,3 | +6,5 | +16,1 | +17,9 | +22,2 | +16,3 | +12,5 | +7,4 | +3,4 | -1,2 | +7,8 |
| Voksenlia | -2,6 | -5,9 | -3,8 | +4,9 | +14,9 | +16,0 | +20,3 | +14,6 | +10,9 | +6,1 | +2,2 | -1,4 | +6,4 |
| Tryvannshøgda | -3,6 | -6,8 | -4,7 | +3,9 | +13,9 | +14,9 | +19,3 | +13,3 | +9,5 | +4,8 | +1,3 | -2,3 | +5,3 |
| Middeltemperatur | jan | feb | mar | apr | mai | jun | jul | aug | sep | okt | nov | des | 2019 |
| Blindern | -2,8 | 0,5 | +2,3 | +8,7 | +10,4 | +15,4 | +17,9 | +16,8 | +11,4 | +5,4 | +1,0 | +0,4 | +7,3 |
| Voksenlia | -2,8 | -0,0 | +0,8 | +7,4 | +8,6 | +13,6 | +16,2 | +14,9 | +10,2 | +4,2 | -0,4 | +0,0 | +6,1 |
| Tryvannshøgda | -3,9 | -0,8 | -0,4 | +6,2 | +7,3 | +12,5 | +15,0 | +13,9 | +8,9 | +3,0 | -1,7 | -0,9 | +4,9 |
| Middeltemperatur | jan | feb | mar | apr | mai | jun | jul | aug | sep | okt | nov | des | 2020 |
| Blindern | +2,7 | +1,9 | | | | | | | | | | | |
| Voksenlia | +1,8 | +0,8 | | | | | | | | | | | |
| Tryvannshøgda | +0,8 | -0,4 | | | | | | | | | | | |
| Maks. temperatur | jan | feb | mar | apr | mai | jun | jul | aug | sep | okt | nov | des | 2004 |
| Blindern | +2,2 | +9,8 | +15,0 | +17,1 | +24,5 | +23,2 | +25,5 | +31,5 | +23,1 | +12,8 | +11,6 | +8,6 | +31,5 |
| Voksenlia | +0,51) | +10,9 | +14,3 | +17,0 | +23,7 | +22,5 | +24,0 | +28,5 | +20,7 | +10,6 | +9,0 | +8,4 | +28,5 |
| Tryvasshøgda | -0,4 | +10,4 | +11,1 | +13,4 | +21,3 | +19,3 | +22,2 | +26,7 | +19,2 | +9,9 | +8,2 | +6,8 | +26,7 |
| Maks. temperatur | jan | feb | mar | apr | mai | jun | jul | aug | sep | okt | nov | des | 2005 |
| Blindern | +9,6 | +7,4 | +13,5 | +17,5 | +19,2 | +25,6 | +31,4 | +25,1 | +22,4 | +17,7 | +12,7 | +7,8 | +31,4 |
| Voksenlia | +8,3 | +7,5 | +12,3 | +14,0 | +16,6 | +22,8 | +28,2 | +22,7 | +20,1 | +15,9 | +10,6 | +8,7 | +28,2 |
| Tryvasshøgda | +6,7 | +6,6 | +11,0 | +13,0 | +15,3 | +21,5 | +26,9 | +22,3 | +18,7 | +14,4 | +10,0 | +7,9 | +26,9 |
| Maks. temperatur | jan | feb | mar | apr | mai | jun | jul | aug | sep | okt | nov | des | 2006 |
| Blindern | +6,9 | +9,7 | +9,4 | +13,2 | +25,2 | +28,5 | +30,5 | +29,9 | +22,5 | +17,5 | +13,2 | +9,6 | +30,5 |
| Voksenlia | +7,9 | +7,7 | +6,6 | +10,4 | +22,3 | +25,6 | +27,0 | +26,4 | +21,1 | +15,0 | +10,8 | +10,0 | +27,0 |
| Tryvasshøgda | +6,6 | +6,3 | +6,1 | +9,2 | +22,0 | +24,0 | +25,4 | +25,2 | +19,1 | +13,9 | +9,5 | +8,5 | +25,4 |
| Maks. temperatur | jan | feb | mar | apr | mai | jun | jul | aug | sep | okt | nov | des | 2007 |
| Blindern | +9,0 | +7,5 | +16,0 | +19,5 | +20,5 | +31,3 | +24,3 | +27,4 | +21,9 | +15,4 | +13,4 | +7,8 | +31,3 |
| Voksenlia | +6,8 | +6,8 | +13,8 | +17,1 | +19,3 | +28,5 | +22,1 | +24,1 | +19,5 | +13,4 | +11,4 | +5,5 | +28,5 |
| Tryvasshøgda | +5,7 | +5,5 | +12,3 | +16,1 | +17,8 | +27,2 | +19,8 | +21,1 | +18,5 | +12,7 | +9,9 | +5,5 | +27,2 |
| Maks. temperatur | jan | feb | mar | apr | mai | jun | jul | aug | sep | okt | nov | des | 2008 |
| Blindern | +7,6 | +9,5 | +8,9 | +20,0 | +28,0 | +31,0 | +31,6 | +27,4 | +19,2 | +15,7 | +9,6 | +7,8 | +31,6 |
| Voksenlia | +5,7 | +8,9 | +6,8 | +18,3 | +25,0 | +28,3 | +29,4 | +24,5 | +16,5 | +14,4 | +8,4 | +5,2 | +29,4 |
| Tryvasshøgda | +3,9 | +7,8 | +5,2 | +16,4 | +23,4 | +26,0 | +26,9 | +22,5 | +15,9 | +13,2 | +9,0 | +4,0 | +26,9 |
| Maks. temperatur | jan | feb | mar | apr | mai | jun | jul | aug | sep | okt | nov | des | 2009 |
| Blindern | +7,1 | +5,9 | +10,4 | +20,4 | +26,4 | +31,8 | +33,0 | +27,7 | +23,0 | +14,8 | +10,0 | +5,1 | +33,0 |
| Voksenlia | +7,9 | +5,2 | +8,2 | +18,6 | +23,1 | +28,8 | +29,9 | +23,9 | +19,0 | +11,5 | +8,0 | +2,8 | +29,9 |
| Tryvasshøgda | +6,5 | +2,5 | +8,0 | +15,7 | +21,5 | +27,1 | +27,8 | +22,2 | +17,8 | +10,0 | +7,3 | +1,5 | +27,8 |
| Maks. temperatur | jan | feb | mar | apr | mai | jun | jul | aug | sep | okt | nov | des | 2010 |
| Blindern | +2,1 | +3,8 | +9,7 | +17,5 | +23,9 | +24,6 | +26,2 | +25,4 | +19,6 | +16,1 | +9,2 | 0,0 | +26,2 |
| Voksenlia | +0,9 | +2,0 | +7,2 | +14,1 | +22,3 | +22,3 | +23,4 | +22,9 | +17,1 | +14,0 | +8,5 | +2,6 | +23,4 |
| Tryvasshøgda | -0,1 | +1,0 | +6,9 | +12,9 | +19,9 | +20,1 | +21,2 | +21,5 | +15,8 | +12,3 | +6,4 | +1,7 | +21,5 |
| Maks. temperatur | jan | feb | mar | apr | mai | jun | jul | aug | sep | okt | nov | des | 2011 |
| Blindern | +5,1 | +5,7 | +14,9 | +20,3 | +23,5 | +27,1 | +28,0 | +26,5 | +21,9 | +16,8 | +11,7 | 12,0 | |
| Voksenlia | +6,0 | +3,2 | +11,5 | +17,7 | +20,7 | +24,5 | +26,0 | +23,5 | +20,7 | +16,4 | +12,1 | +9,7 | +26,0 |
| Tryvasshøgda | +5,1 | +1,0 | +11,4 | +16,0 | +19,0 | +22,9 | +23,9 | +22,3 | +20,4 | +17,7 | +11,6 | +8,0 | |
| Maks. temperatur | jan | feb | mar | apr | mai | jun | jul | aug | sep | okt | nov | des | 2012 |
| Blindern | +4,6 | +10,1 | +21,5 | +14,9 | +29,8 | +23,8 | +25,1 | +26,9 | +23,0 | +11,6 | +10,6 | +4,7 | +29,8 |
| Voksenlia | +3,7 | +11,3 | +19,0 | +13,4 | +28,1 | +21,3 | +23,9 | +24,8 | +19,6 | +13,8 | +7,9 | +2,7 | +28,1 |
| Tryvannshøgda | +4,4 | +11,4 | +17,8 | +11,5 | +26,6 | +19,6 | +22,2 | +23,4 | +18,4 | +16,2 | +9,5 | +6,1 | +26,6 |
| Maks. temperatur | jan | feb | mar | apr | mai | jun | jul | aug | sep | okt | nov | des | 2013 |
| Blindern | +5,5 | +7,9 | +10,1 | +14,6 | +26,8 | +25,1 | +29,0 | +25,8 | +23,3 | +19,1 | +13,7 | +8,7 | |
| Voksenlia | +4,9 | +7,5 | +6,8 | +12,1 | +24,3 | +22,1 | +26,8 | +23,1 | +20,8 | +15,7 | +12,2 | +6,4 | +26,8 |
| Tryvannshøgda | +6,4 | +7,9 | +6,5 | +11,0 | +23,8 | +20,1 | +25,0 | +22,6 | +19,6 | +14,3 | +10,8 | +7,3 | |
| Maks. temperatur | jan | feb | mar | apr | mai | jun | jul | aug | sep | okt | nov | des | 2014 |
| Blindern | +7,4 | +7,6 | +15,5 | +22,4 | +26,4 | +27,1 | +33,4 | +21,7 | +22,4 | +16,4 | +12,1 | +7,0 | |
| Voksenlia | +5,1 | +5,6 | +13,9 | +20,4 | +23,5 | +25,1 | +31,0 | +23,1 | +19,7 | +14,0 | +10,3 | +8,9 | |
| Tryvannshøgda | +4,3 | +3,9 | +14,0 | +18,1 | +23,0 | +23,0 | +29,9 | +26,4 | +18,2 | +12,5 | +9,8 | +8,5 | |
| Maks. temperatur | jan | feb | mar | apr | mai | jun | jul | aug | sep | okt | nov | des | 2015 |
| Blindern | +6,5 | +8,4 | +13,2 | +22,8 | +18,8 | +24,4 | +27,0 | +25,4 | +21,1 | +16,7 | +12,3 | +10,4 | |
| Voksenlia | +5,2 | +8,9 | +9,5 | +22,0 | +16,5 | +22,2 | +25,0 | +23,4 | +19,6 | +14,0 | +13,3 | +9,2 | +25,0 |
| Tryvannshøgda | +5,1 | +7,7 | +8,2 | +20,0 | +14,5 | +20,6 | +23,2 | +22,0 | +18,2 | +14,0 | +12,9 | +7,8 | |
| Maks. temperatur | jan | feb | mar | apr | mai | jun | jul | aug | sep | okt | nov | des | 2016 |
| Blindern | +7,3 | +7,1 | +15,7 | +14,4 | +26,4 | +29,1 | +27,8 | +23,8 | +23,4 | +15,0 | +9,1 | +11,5 | |
| Voksenlia | +4,1 | +5,3 | +15,1 | +13,0 | +24,7 | +27,6 | +26,2 | +23,0 | +23,9 | +13,5 | +8,8 | +9,7 | |
| Tryvannshøgda | +3,6 | +4,4 | +14,3 | +11,2 | +22,8 | +25,4 | +24,5 | +21,5 | - | - | +7,5 | +8,5 | |
| Maks. temperatur | jan | feb | mar | apr | mai | jun | jul | aug | sep | okt | nov | des | 2017 |
| Blindern | +5,5 | +7,5 | +20,0 | +17,6 | +23,9 | +25,6 | +27,3 | +23,6 | +18,9 | +16,9 | +10,9 | +8,4 | +27,3 |
| Voksenlia | +8,1 | +7,0 | +18,1 | +15,5 | +22,6 | +23,8 | +24,9 | +21,0 | +17,0 | +14,7 | +8,6 | +5,8 | +24,9 |
| Tryvannshøgda | +7,2 | +7,5 | +16,4 | +13,6 | +21,4 | +21,6 | +22,7 | +19,8 | +15,7 | +13,3 | +7,9 | +5,9 | +22,7 |
| Maks. temperatur | jan | feb | mar | apr | mai | jun | jul | aug | sep | okt | nov | des | 2018 |
| Blindern | +5,6 | +2,0 | +10,0 | +17,8 | +31,1 | +31,9 | +34,6 | +28,5 | +22,2 | +17,8 | +11,5 | +7,2 | +34,6 |
| Voksenlia | +3,9 | -0,3 | +7,8 | +15,3 | +28,7 | +30,2 | +32,5 | +25,6 | +21,1 | +16,7 | +8,6 | +6,8 | +32,5 |
| Tryvannshøgda | +2,8 | 0,0 | +8,2 | +14,0 | +27,4 | +28,4 | +31,0 | +24,0 | +19,6 | +14,6 | +8,0 | +5,2 | +31,0 |
| Maks. temperatur | jan | feb | mar | apr | mai | jun | jul | aug | sep | okt | nov | des | 2019 |
| Blindern | +10,4 | +11,1 | +15,5 | +24,3 | +24,8 | +28,0 | +31,7 | +27,6 | +22,5 | +14,1 | +6,9 | +8,4 | +31,7 |
| Voksenlia | +8,9 | +10,9 | +13,5 | +23,1 | +22,0 | +25,8 | +30,0 | +25,1 | +21,0 | +12,5 | +5,4 | +7,4 | +30,0 |
| Tryvasshøgda | +7,4 | +12,0 | +11,6 | +21,0 | +22,4 | +24,6 | +29,1 | +24,0 | +21,5 | +11,0 | +4,2 | +8,7 | +29,1 |
| Maks. temperatur | jan | feb | mar | apr | mai | jun | jul | aug | sep | okt | nov | des | 2020 |
| Blindern | +9,0 | +9,3 | | | | | | | | | | | |
| Voksenlia | +9,6 | +8,7 | | | | | | | | | | | |
| Tryvannshøgda | +8,0 | +7,9 | | | | | | | | | | | |
| Min. temperatur | jan | feb | mar | apr | mai | jun | jul | aug | sep | okt | nov | des | 2004 |
| Blindern | -15,6 | -12,4 | -11,8 | -2,6 | +2,0 | +6,4 | +8,3 | +6,1 | +3,8 | -1,8 | -9,8 | -9,6 | -15,6 |
| Voksenlia | -15,51) | -10,5 | -11,2 | -3,7 | +0,3 | +4,2 | +6,6 | +6,6 | +3,6 | +0,1 | -8,6 | -9,5 | -15,51) |
| Tryvasshøgda | -15,9 | -9,3 | -11,5 | -5,0 | -0,2 | +3,7 | +6,6 | +5,2 | +2,1 | -1,0 | -12,0 | -9,7 | -15,9 |
| Min. temperatur | jan | feb | mar | apr | mai | jun | jul | aug | sep | okt | nov | des | 2005 |
| Blindern | -6,5 | -10,0 | -16,9 | -1,5 | +0,4 | +3,0 | +9,4 | +5,9 | +1,4 | -3,3 | -7,8 | -8,3 | -16,9 |
| Voksenlia | -5,9 | -12,1 | -13,9 | -2,7 | +0,8 | +3,6 | +9,5 | +6,3 | +3,4 | -3,1 | -6,9 | -10,8 | -13,9 |
| Tryvasshøgda | -7,2 | -13,6 | -16,0 | -2,6 | -0,7 | +2,0 | +7,8 | +4,8 | +2,0 | -5,8 | -8,0 | -11,0 | -16,0 |
| Min. temperatur | jan | feb | mar | apr | mai | jun | jul | aug | sep | okt | nov | des | 2006 |
| Blindern | -11,1 | -15,7 | -15,0 | -2,4 | +2,2 | +6,1 | +9,0 | +9,4 | +7,5 | -0,2 | -5,6 | -5,7 | -15,7 |
| Voksenlia | -11,0 | -12,0 | -13,8 | -3,0 | +1,7 | +3,7 | +9,6 | +9,5 | +7,5 | -2,5 | -6,2 | -4,9 | -13,8 |
| Tryvasshøgda | -13,2 | -11,5 | -15,4 | -4,3 | +0,4 | +2,0 | +8,1 | +7,8 | +6,3 | -3,7 | -8,3 | -3,9 | -15,4 |
| Min. temperatur | jan | feb | mar | apr | mai | jun | jul | aug | sep | okt | nov | des | 2007 |
| Blindern | -14,3 | -14,5 | -3,6 | -3,1 | +2,6 | +5,3 | +9,9 | +4,2 | +1,6 | -2,5 | -6,2 | -11,6 | -14,5 |
| Voksenlia | -11,8 | -15,6 | -2,4 | -2,9 | +2,2 | +3,9 | +9,1 | +4,9 | +2,4 | -1,5 | -5,2 | -11,3 | -15,6 |
| Tryvasshøgda | -13,2 | -17,0 | -3,6 | -4,7 | +0,1 | +2,4 | +8,0 | +2,3 | +1,3 | -2,2 | -7,3 | -10,6 | -17,0 |
| Min. temperatur | jan | feb | mar | apr | mai | jun | jul | aug | sep | okt | nov | des | 2008 |
| Blindern | -5,7 | -8,5 | -13,1 | -0,8 | +0,6 | +6,4 | +8,4 | +8,6 | +4,0 | -2,8 | -7,4 | -9,9 | -13,1 |
| Voksenlia | -6,7 | -7,6 | -11,7 | -0,7 | +0,4 | +6,4 | +7,7 | +8,5 | +4,4 | -2,6 | -5,0 | -11,0 | -11,7 |
| Tryvasshøgda | -8,4 | -9,7 | -13,4 | -2,5 | -0,9 | +4,3 | +6,7 | +6,7 | +2,8 | -4,0 | -7,6 | -10,5 | -13,4 |
| Min. temperatur | jan | feb | mar | apr | mai | jun | jul | aug | sep | okt | nov | des | 2009 |
| Blindern | -12,2 | -15,8 | -7,3 | -1,0 | +2,6 | +4,8 | +10,5 | +6,6 | +0,1 | -2,8 | -1,1 | -17,5 | -17,5 |
| Voksenlia | -9,4 | -13,4 | -6,8 | -2,5 | +2,3 | +2,8 | +9,6 | +7,3 | +2,0 | -2,6 | -3,0 | -15,1 | -15,1 |
| Tryvasshøgda | -12,0 | -14,1 | -8,6 | -1,6 | +0,6 | +1,3 | +8,2 | +6,2 | +0,9 | -3,9 | -4,5 | -16,1 | -16,1 |
| Min. temperatur | jan | feb | mar | apr | mai | jun | jul | aug | sep | okt | nov | des | 2010 |
| Blindern | -20,5 | -17,7 | -14,0 | -2,6 | -1,5 | +7,4 | +9,6 | +7,9 | +1,4 | -5,0 | -12,1 | -19,3 | -20,5 |
| Voksenlia | -18,1 | -17,4 | -9,6 | -2,5 | -0,9 | +5,2 | +6,3 | +7,1 | +1,8 | -3,8 | -13,2 | -17,3 | -18,1 |
| Tryvasshøgda | -18,2 | -19,5 | -11,1 | -3,8 | -2,3 | +3,6 | +5,6 | +4,8 | +1,2 | -5,5 | -15,0 | -18,1 | -19,5 |
| Min. temperatur | jan | feb | mar | apr | mai | jun | jul | aug | sep | okt | nov | des | 2011 |
| Blindern | -12,8 | -18,1 | -8,1 | -0,8 | 0,0 | +8,0 | +9,6 | +6,7 | +3,0 | -2,2 | -4,9 | -7,2 | |
| Voksenlia | -9,5 | -13,9 | -7,5 | -1,1 | +0,8 | +7,1 | +8,5 | +6,4 | +5,3 | -0,4 | -6,0 | -7,3 | -13,9 |
| Tryvasshøgda | -12,0 | -14,7 | -8,7 | -2,4 | -0,7 | +5,4 | +7,0 | +5,0 | +3,9 | -1,3 | -5,6 | -8,0 | |
| Min. temperatur | jan | feb | mar | apr | mai | jun | jul | aug | sep | okt | nov | des | 2012 |
| Blindern | -11,3 | -17,1 | -3,2 | -4,1 | -1,3 | +4,9 | +9,0 | +7,3 | +1,3 | -6,5 | -4,9 | -14,6 | -17,1 |
| Voksenlia | -11,2 | -16,5 | -4,0 | -5,9 | -1,1 | +1,8 | +7,8 | +5,2 | +3,0 | -4,6 | -7,3 | -15,0 | -16,5 |
| Tryvannshøgda | -12,1 | -18,5 | -5,7 | -7,5 | -3,2 | +0,4 | +7,1 | +3,8 | +1,2 | -5,0 | -8,9 | -17,0 | -18,5 |
| Min. temperatur | jan | feb | mar | apr | mai | jun | jul | aug | sep | okt | nov | des | 2013 |
| Blindern | -17,2 | -13,2 | -14,2 | -4,9 | +0,1 | +6,6 | +9,5 | +7,5 | +0,5 | -1,5 | -7,5 | -8,9 | |
| Voksenlia | -15,1 | -10,6 | -11,8 | -4,1 | +0,1 | +5,5 | +8,7 | +9,1 | +2,1 | -0,7 | -6,6 | -7,3 | -15,1 |
| Tryvannshøgda | -15,7 | -12,1 | -13,6 | -5,9 | -2,0 | +4,0 | +7,6 | +7,4 | +0,8 | -2,2 | -6,7 | -8,8 | |
| Min. temperatur | jan | feb | mar | apr | mai | jun | jul | aug | sep | okt | nov | des | 2014 |
| Blindern | -13,5 | -8,4 | -2,8 | -1,5 | +0,7 | +8,7 | +9,0 | +7,6 | +3,6 | -0,4 | -3,3 | -14,6 | |
| Voksenlia | -13,0 | -7,1 | -3,5 | -1,0 | -1,3 | +6,6 | +10,5 | +8,7 | +4,5 | -0,1 | -4,5 | -11,7 | |
| Tryvannshøgda | -14,4 | -5,0 | -4,9 | -2,8 | -3,2 | +3,4 | +8,3 | +7,1 | +2,5 | -1,3 | -5,5 | -12,5 | |
| Min. temperatur | jan | feb | mar | apr | mai | jun | jul | aug | sep | okt | nov | des | 2015 |
| Blindern | -12,2 | -12,8 | -4,8 | -2,3 | +0,1 | +5,1 | +7,8 | +8,0 | +3,0 | -2,3 | -7,7 | -8,9 | |
| Voksenlia | -10,8 | -10,2 | -4,7 | -1,8 | +1,4 | +4,2 | +7,1 | +8,2 | +5,5 | +1,6 | -6,2 | -8,3 | -10,8 |
| Tryvannshøgda | -11,9 | -10,1 | -6,1 | -3,5 | -0,1 | +2,8 | +5,8 | +6,8 | +3,8 | +0,6 | -7,8 | -7,3 | |
| Min. temperatur | jan | feb | mar | apr | mai | jun | jul | aug | sep | okt | nov | des | 2016 |
| Blindern | -16,4 | -10,6 | -3,6 | -1,8 | +0,8 | +6,1 | +8,4 | +6,6 | +5,0 | 0,0 | -8,1 | -8,3 | |
| Voksenlia | -13,5 | -8,8 | -3,6 | -2,0 | +1,2 | +5,2 | +7,6 | +5,6 | +6,6 | -1,9 | -10,3 | -7,5 | |
| Tryvannshøgda | -16,7 | -11,4 | -5,5 | -3,6 | +0,1 | +3,6 | +6,4 | +4,4 | - | - | -9,4 | -4,5 | |
| Min. temperatur | jan | feb | mar | apr | mai | jun | jul | aug | sep | okt | nov | des | 2017 |
| Blindern | -12,6 | -9,5 | -5,7 | -4,4 | +0,2 | +3,5 | +7,0 | +6,9 | +6,6 | -1,3 | -7,4 | -10,4 | -12,6 |
| Voksenlia | -12,4 | -10,3 | -8,7 | -4,1 | -0,7 | +4,4 | +8,4 | +8,1 | +5,5 | -1,0 | -8,9 | -9,2 | -12,4 |
| Tryvannshøgda | -14,0 | -11,4 | -10,2 | -6,3 | -1,6 | +2,0 | +6,6 | +5,9 | +3,7 | - | -10,7 | -9,2 | -14,0 |
| Min. temperatur | jan | feb | mar | apr | mai | jun | jul | aug | sep | okt | nov | des | 2018 |
| Blindern | -11,7 | -15,9 | -14,2 | -6,1 | +1,5 | +6,2 | +10,6 | +5,9 | -0,2 | -2,2 | -9,4 | -11,9 | -15,9 |
| Voksenlia | -8,3 | -15,2 | -17,0 | -6,0 | +0,8 | +4,8 | +11,5 | +7,4 | +2,5 | -3,9 | -7,9 | -11,8 | -17,0 |
| Tryvannshøgda | -8,7 | -16,6 | -18,1 | -8,1 | -0,3 | +2,2 | +10,4 | +5,5 | +0,8 | -5,3 | -7,6 | -13,5 | -18,1 |
| Min. temperatur | jan | feb | mar | apr | mai | jun | jul | aug | sep | okt | nov | des | 2019 |
| Blindern | -14,1 | -12,6 | -8,6 | -4,5 | -1,8 | +6,8 | +9,2 | +8,5 | +2,6 | -2,9 | -7,2 | -7,9 | -14,1 |
| Voksenlia | -11,5 | -9,4 | -6,7 | -3,6 | -1,8 | +6,8 | +6,9 | +8,5 | +3,5 | -1,3 | -6,2 | -8,3 | -11,5 |
| Tryvasshøgda | -11,9 | -8,4 | -9,7 | -5,5 | -3,4 | +5,8 | +5,4 | +7,8 | +2,0 | -2,9 | -7,8 | -9,9 | -11,9 |
| Min. temperatur | jan | feb | mar | apr | mai | jun | jul | aug | sep | okt | nov | des | 2020 |
| Blindern | -5,7 | -7,5 | | | | | | | | | | | |
| Voksenlia | -3,4 | -7,3 | | | | | | | | | | | |
| Tryvannshøgda | -4,6 | -9,6 | | | | | | | | | | | |
| Midlere maksimumstemp. | jan | feb | mar | apr | mai | jun | jul | aug | sep | okt | nov | des | 2004 |
| Blindern | - | - | - | - | +17,7 | +19,6 | +21,0 | +22,8 | +17,1 | +8,8 | +4,1 | +2,9 | - |
| Voksenlia | -3,61) | +2,5 | +5,7 | +10,4 | +16,6 | +18,2 | +18,4 | +20,1 | +14,8 | +6,8 | +2,8 | +2,4 | +9,71) |
| Tryvasshøgda | - | - | - | - | +13,9 | +15,4 | +17,0 | +18,6 | +13,6 | +5,6 | +1,5 | +1,5 | - |
| Midlere maksimumtemp. | jan | feb | mar | apr | mai | jun | jul | aug | sep | okt | nov | des | 2005 |
| Blindern | +4,0 | +2,0 | +4,2 | +12,3 | +14,6 | +19,6 | +23,7 | +20,3 | +16,9 | +10,7 | +6,8 | +0,9 | - |
| Voksenlia | +2,5 | +0,1 | +2,2 | +9,8 | +11,8 | +16,7 | +21,0 | +17,6 | +14,7 | +8,9 | +4,9 | +0,1 | +9,1 |
| Tryvasshøgda | +1,5 | -1,1 | +1,5 | +8,2 | +10,8 | +15,5 | +19,8 | +16,5 | +13,1 | +8,2 | +4,1 | -1,0 | - |
| Midlere maksimumstemp. | jan | feb | mar | apr | mai | jun | jul | aug | sep | okt | nov | des | 2006 |
| Blindern | -0,2 | +0,1 | +1,0 | +8,3 | +16,6 | +21,7 | +25,8 | +22,7 | +18,9 | +10,6 | +7,0 | +4,9 | - |
| Voksenlia | -1,4 | -0,3 | -1,0 | +5,5 | +13,7 | +18,6 | +22,8 | +20,3 | +16,6 | +8,7 | +5,5 | +4,9 | +9,6 |
| Tryvasshøgda | -2,3 | -1,1 | -2,0 | +4,3 | +12,6 | +17,4 | +21,3 | +18,7 | +15,2 | +7,8 | +4,4 | +4,6 | - |
| Midlere maksimumstemp. | jan | feb | mar | apr | mai | jun | jul | aug | sep | okt | nov | des | 2007 |
| Blindern | +2,1 | -1,0 | +8,5 | +13,2 | +15,4 | +22,7 | +20,1 | +21,1 | +15,1 | +10,5 | +4,6 | +1,7 | - |
| Voksenlia | +1,3 | -2,8 | +6,3 | +10,5 | +12,7 | +20,0 | +17,5 | +18,5 | +13,1 | +8,9 | +3,6 | +0,9 | +9,3 |
| Tryvasshøgda | +0,1 | -3,8 | +5,0 | +9,3 | +11,2 | +18,4 | +16,1 | +16,9 | +11,8 | +8,1 | +2,6 | +3,0 | - |
| Midlere maksimumstemp. | jan | feb | mar | apr | mai | jun | jul | aug | sep | okt | nov | des | 2008 |
| Blindern | +2,9 | +4,7 | +4,2 | +10,9 | +16,6 | +19,3 | +24,0 | +19,5 | +14,2 | +10,1 | +5,1 | +1,1 | +11,4 |
| Voksenlia | +1,3 | +3,5 | +2,2 | +8,6 | +15,6 | +18,3 | +21,6 | +17,3 | +12,2 | +8,5 | +4,1 | +0,3 | +9,5 |
| Tryvasshøgda | -0,1 | +2,4 | +0,3 | +6,9 | +14,4 | +16,8 | +19,9 | +15,8 | +10,7 | +6,9 | +3,0 | -1,1 | +8,0 |
| Midlere maksimumstemp. | jan | feb | mar | apr | mai | jun | jul | aug | sep | okt | nov | des | 2009 |
| Blindern | +0,0 | -1,7 | +4,7 | +13,4 | +17,9 | +21,8 | +22,6 | +21,3 | +18,2 | +8,4 | +5,7 | -1,6 | |
| Voksenlia | -0,5 | -3,1 | +2,1 | +10,5 | +14,5 | +18,5 | +19,1 | +18,0 | +15,5 | +6,3 | +3,6 | -2,7 | +8,6 |
| Tryvasshøgda | -1,7 | -3,9 | +1,1 | +9,6 | +13,2 | +16,9 | +17,6 | +16,6 | +13,8 | +5,1 | +2,3 | -3,8 | |
| Midlere maksimumstemp. | jan | feb | mar | apr | mai | jun | jul | aug | sep | okt | nov | des | 2010 |
| Blindern | -5,5 | -4,9 | +4,6 | +11,2 | +16,0 | +20,4 | +22,4 | +20,2 | +15,5 | +9,2 | +0,3 | -6,5 | |
| Voksenlia | -5,3 | -4,8 | +2,5 | +8,5 | +13,3 | +17,7 | +19,5 | +17,8 | +13,3 | +7,4 | -1,5 | -6,3 | +6,9 |
| Tryvasshøgda | -6,5 | -5,8 | +1,9 | +6,8 | +12,0 | +16,1 | +18,0 | +16,3 | +11,9 | +6,1 | -2,8 | -7,2 | |
| Midlere maksimumstemp. | jan | feb | mar | apr | mai | jun | jul | aug | sep | okt | nov | des | 2011 |
| Blindern | -0,6 | -1,9 | +4,8 | +15,3 | +14,4 | +20,5 | +22,4 | +20,6 | +16,8 | +11,0 | +6,7 | +3,4 | |
| Voksenlia | -0,5 | -3,5 | +2,7 | +12,7 | +13,7 | +17,6 | +19,6 | +18,0 | +14,6 | +9,3 | +5,9 | +2,0 | +9,4 |
| Tryvasshøgda | -1,4 | -4,4 | +1,9 | +11,6 | +12,1 | +16,5 | +18,6 | +16,7 | +13,3 | +7,9 | +5,4 | +0,6 | |
| Midlere maksimumstemp. | jan | feb | mar | apr | mai | jun | jul | aug | sep | okt | nov | des | 2012 |
| Blindern | -0,2 | +0,8 | +10,9 | +9,0 | +17,4 | +18,3 | +20,3 | +20,8 | +16,1 | +8,4 | +5,0 | -2,9 | |
| Voksenlia | -1,3 | -0,1 | +9,2 | +6,8 | +15,0 | +15,8 | +18,0 | +18,5 | +13,7 | +6,6 | +3,3 | -4,6 | +8,2 |
| Tryvannshøgda | -2,5 | -1,6 | +7,5 | +5,1 | +13,4 | +14,3 | +16,5 | +17,0 | +11,9 | +5,3 | +2,5 | -5,4 | |
| Midlere maksimumstemp | jan | feb | mar | apr | mai | jun | jul | aug | sep | okt | nov | des | 2013 |
| Blindern | -2,2 | +0,1 | +2,9 | +9,1 | +17,7 | +20,0 | +24,1 | +21,9 | +16,9 | +11,3 | +5,6 | +4,5 | |
| Voksenlia | -2,8 | -1,2 | +0,8 | +6,8 | +15,2 | +17,6 | +21,8 | +19,4 | +15,1 | +9,5 | +4,6 | +3,2 | +9,2 |
| Tryvannshøgda | -3,1 | -1,7 | -0,4 | +5,5 | +14,0 | +16,0 | +20,2 | +17,7 | +13,4 | +8,2 | +3,4 | +2,4 | |
| Midlere maksimumstemp | jan | feb | mar | apr | mai | jun | jul | aug | sep | okt | nov | des | 2014 |
| Blindern | -1,3 | +3,3 | +8,0 | +13,4 | +17,3 | +21,2 | +26,8 | +21,0 | +18,4 | +11,8 | +5,5 | +0,2 | |
| Voksenlia | -3,2 | +1,2 | +5,9 | +11,1 | +14,8 | +18,8 | +24,4 | +18,3 | +16,3 | +10,0 | +3,9 | +0,8 | |
| Tryvannshøgda | -4,7 | +0,2 | +4,6 | +9,7 | +13,6 | +17,5 | | +17,0 | +14,9 | +8,6 | +2,8 | 0,0 | |
| Midlere maksimumstemp | jan | feb | mar | apr | mai | jun | jul | aug | sep | okt | nov | des | 2015 |
| Blindern | +2,1 | +2,9 | +7,3 | +12,6 | +14,2 | +19,9 | +21,6 | +21,7 | +16,7 | +11,2 | +6,2 | +4,6 | |
| Voksenlia | +0,7 | +1,6 | +5,3 | +10,6 | +11,6 | +17,1 | +19,3 | +19,4 | +14,6 | +9,3 | +5,1 | +3,3 | +11,3 |
| Tryvannshøgda | -0,4 | +0,5 | +3,9 | +8,7 | +10,4 | +16,0 | +17,7 | +17,9 | +13,1 | +8,3 | +4,5 | +2,5 | |
| Midlere maksimumstemp | jan | feb | mar | apr | mai | jun | jul | aug | sep | okt | nov | des | 2016 |
| Blindern | -3,1 | +2,7 | +6,7 | +10,1 | +17,4 | +21,8 | +22,3 | +20,2 | +19,4 | +8,7 | +3,2 | +3,6 | |
| Voksenlia | -3,7 | +1,1 | +4,9 | +8,0 | +15,5 | +19,8 | +20,0 | +18,2 | +17,7 | +7,0 | +1,7 | +3,5 | |
| Tryvannshøgda | -4,8 | -0,1 | +3,6 | +6,5 | +14,0 | +18,1 | +18,4 | +16,7 | - | - | +0,8 | +2,9 | |
| Midlere maksimumstemp | jan | feb | mar | apr | mai | jun | jul | aug | sep | okt | nov | des | 2017 |
| Blindern | +1,4 | +1,0 | +6,6 | +10,1 | +16,8 | +19,5 | +22,0 | +19,9 | +15,3 | +10,9 | +4,6 | +0,9 | |
| Voksenlia | +1,4 | -0,1 | +4,7 | +7,9 | +14,8 | +17,3 | +19,7 | +17,7 | +12,9 | +9,3 | +3,4 | +0,9 | +9,2 |
| Tryvannshøgda | +0,8 | -0,3 | +3,4 | +6,7 | +13,7 | +16,2 | +18,4 | +16,3 | +11,8 | +7,9 | +2,1 | +0,3 | |
| Midlere maksimumstemp | jan | feb | mar | apr | mai | jun | jul | aug | sep | okt | nov | des | 2018 |
| Blindern | +0,3 | -1,5 | +1,8 | +11,4 | +22,8 | +23,9 | +29,0 | +21,4 | +17,0 | +10,9 | +5,4 | +0,7 | +11,9 |
| Voksenlia | -0,8 | -3,8 | -0,5 | +9,1 | +20,8 | +21,9 | +26,8 | +19,3 | +15,1 | +10,6 | +3,9 | +0,4 | +10,2 |
| Tryvannshøgda | -1,8 | -4,1 | -1,1 | +8,2 | +19,2 | +20,3 | +25,4 | +17,6 | +13,5 | +7,8 | +3,0 | -0,6 | +9,0 |
| Midlere maksimumstemp | jan | feb | mar | apr | mai | jun | jul | aug | sep | okt | nov | des | 2019 |
| Blindern | +0,1 | +3,1 | +6,4 | +14,6 | +15,3 | +20,6 | +23,5 | +21,5 | +15,6 | +8,4 | +2,4 | +2,3 | +11,2 |
| Voksenlia | -0,6 | +2,1 | +4,1 | +12,7 | +13,1 | +18,5 | +21,5 | +18,7 | +13,8 | +6,7 | +1,0 | +1,9 | +9,5 |
| Tryvasshøgda | -1,5 | +1,4 | +3,0 | +11,0 | +11,9 | +17,2 | +20,3 | +17,8 | +12,4 | +5,4 | -0,4 | +0,9 | +8,3 |
| Midlere maksimumstemp | jan | feb | mar | apr | mai | jun | jul | aug | sep | okt | nov | des | 2020 |
| Blindern | +5,0 | +5,0 | | | | | | | | | | | |
| Voksenlia | +3,8 | +3,7 | | | | | | | | | | | |
| Tryvannshøgda | +2,6 | +2,4 | | | | | | | | | | | |
| Midlere minimumstemp. | jan | feb | mar | apr | mai | jun | jul | aug | sep | okt | nov | des | 2004 |
| Blindern | - | - | - | - | +7,3 | +9,9 | +11,8 | +13,7 | +8,7 | +4,6 | -1,9 | -2,6 | - |
| Voksenlia | -6,91) | -5,1 | -2,9 | +2,3 | +5,9 | +8,0 | +10,7 | +13,0 | +8,5 | +3,3 | -1,8 | -2,2 | +2,61) |
| Tryvasshøgda | - | - | - | - | +5,3 | +7,4 | +9,4 | +11,8 | +7,1 | +2,2 | -3,2 | -3,1 | - |
| Midlere minimumstemp. | jan | feb | mar | apr | mai | jun | jul | aug | sep | okt | nov | des | 2005 |
| Blindern | -0,8 | -3,5 | -4,8 | +2,4 | +5,7 | +10,1 | +14,5 | +12,2 | +9,0 | +4,8 | +2,1 | -3,4 | - |
| Voksenlia | -1,5 | -4,9 | -4,8 | +1,9 | +4,6 | +8,7 | +13,5 | +11,1 | +8,3 | +4,3 | +1,2 | -3,6 | +3,1 |
| Tryvasshøgda | -2,7 | -6,0 | -5,5 | +0,7 | +3,4 | +7,5 | +12,3 | +9,9 | +7,3 | +3,4 | +0,1 | -4,4 | - |
| Midlere minimumstemp. | jan | feb | mar | apr | mai | jun | jul | aug | sep | okt | nov | des | 2006 |
| Blindern | -4,5 | -5,9 | -7,2 | +1,5 | +7,8 | +11,2 | +15,0 | +14,6 | +11,8 | +6,6 | +1,4 | +0,3 | - |
| Voksenlia | -4,8 | -5,4 | -6,7 | +0,1 | +6,4 | +9,5 | +14,0 | +13,4 | +10,7 | +4,9 | +1,3 | +0,6 | +3,8 |
| Tryvasshøgda | -5,9 | -6,0 | -7,9 | -0,9 | +5,1 | +8,8 | +12,9 | +12,3 | +9,7 | +4,1 | +0,1 | +0,5 | - |
| Midlere minimumstemp. | jan | feb | mar | apr | mai | jun | jul | aug | sep | okt | nov | des | 2007 |
| Blindern | -4,0 | -5,1 | +0,6 | +2,8 | +5,6 | +12,0 | +13,1 | +12,8 | +7,3 | +3,7 | -1,2 | -3,7 | - |
| Voksenlia | -3,5 | -6,5 | +0,8 | +2,4 | +5,5 | +11,6 | +11,5 | +11,6 | +6,4 | +3,5 | -1,5 | -3,9 | +3,2 |
| Tryvasshøgda | -4,5 | -7,6 | -0,2 | +1,4 | +4,2 | +10,8 | +10,2 | +10,4 | +5,3 | +2,6 | -2,5 | -3,5 | - |
| Midlere minimumstemp. | jan | feb | mar | apr | mai | jun | jul | aug | sep | okt | nov | des | 2008 |
| Blindern | -1,3 | -0,4 | -2,1 | +3,3 | +6,7 | +10,9 | +13,2 | +12,0 | +8,1 | +3,9 | -0,7 | -3,3 | +4,2 |
| Voksenlia | -2,3 | -1,1 | -3,1 | +2,4 | +7,2 | +10,3 | +13,0 | +11,0 | +7,3 | +3,6 | -0,3 | -3,7 | +3,7 |
| Tryvasshøgda | -3,5 | -2,4 | -4,6 | +1,0 | +6,0 | +9,1 | +11,9 | +9,7 | +6,2 | +2,4 | -1,6 | -4,7 | +2,5 |
| Midlere minimumstemp. | jan | feb | mar | apr | mai | jun | jul | aug | sep | okt | nov | des | 2009 |
| Blindern | -4,4 | -7,7 | -1,8 | +3,3 | +6,9 | +10,5 | +13,7 | +12,4 | +8,5 | +1,2 | +2,0 | -5,9 | |
| Voksenlia | -4,6 | -7,1 | -2,4 | +3,1 | +6,2 | +9,8 | +12,4 | +11,1 | +8,3 | +1,1 | +0,5 | -6,1 | +2,8 |
| Tryvasshøgda | -5,9 | -8,0 | -3,6 | +2,4 | +4,9 | +8,5 | +11,2 | +10,1 | +7,3 | -0,1 | -0,7 | -7,2 | |
| Midlere minimumstemp. | jan | feb | mar | apr | mai | jun | jul | aug | sep | okt | nov | des | 2010 |
| Blindern | -10,3 | -9,0 | -3,3 | +1,5 | +6,4 | +11,0 | +14,4 | +13,3 | +7,7 | +2,9 | -3,8 | -12,1 | |
| Voksenlia | -9,6 | -8,8 | -2,9 | +1,0 | +5,1 | +9,4 | +12,5 | +11,6 | +6,8 | +2,5 | -5,1 | -11,4 | +1,0 |
| Tryvasshøgda | -10,6 | -10,0 | -3,9 | 0,0 | +3,7 | +8,1 | +11,3 | +10,4 | +5,5 | +1,4 | -6,3 | -11,8 | |
| Midlere minimumstemp. | jan | feb | mar | apr | mai | jun | jul | aug | sep | okt | nov | des | 2011 |
| Blindern | -6,0 | -7,5 | -3,2 | +4,3 | +7,1 | +12,1 | +14,7 | +12,8 | +9,7 | +4,6 | +2,8 | -2,1 | |
| Voksenlia | -5,1 | -7,6 | -3,7 | +4,3 | +5,8 | +10,5 | +13,0 | +11,6 | +8,7 | +4,0 | +1,7 | -2,2 | +3,5 |
| Tryvasshøgda | -5,6 | -8,8 | -4,6 | +3,5 | +4,6 | +9,3 | +11,8 | +10,4 | +7,6 | +2,9 | +1,0 | -3,5 | |
| Midlere minimumstemp. | jan | feb | mar | apr | mai | jun | jul | aug | sep | okt | nov | des | 2012 |
| Blindern | -4,4 | -5,3 | +1,4 | +1,6 | +7,9 | +9,9 | +13,1 | +12,8 | +7,1 | +2,6 | +1,1 | -7,4 | |
| Voksenlia | -4,9 | -5,8 | +1,3 | -0,1 | +6,4 | +8,2 | +11,6 | +11,2 | +6,7 | +1,7 | -0,1 | -8,3 | +2,3 |
| Tryvannshøgda | -6,0 | -6,6 | +0,4 | -1,3 | +5,3 | +6,9 | +10,4 | +10,1 | +5,4 | +0,5 | -1,1 | -9,7 | |
| Midlere minimumstemp. | jan | feb | mar | apr | mai | jun | jul | aug | sep | okt | nov | des | 2013 |
| Blindern | -7,3 | -5,9 | -6,4 | 0,0 | +8,7 | +10,9 | +13,3 | +11,9 | +8,4 | +4,3 | -0,4 | -0,7 | |
| Voksenlia | -7,5 | -5,7 | -6,4 | -0,6 | +7,4 | +9,7 | +12,6 | +11,5 | +8,2 | +3,7 | -0,6 | -1,1 | +2,7 |
| Tryvannshøgda | -7,8 | -6,2 | -7,7 | -1,6 | +6,4 | +8,3 | +11,3 | +10,3 | +7,0 | +3,2 | -1,2 | -2,0 | |
| Midlere minimumstemp | jan | feb | mar | apr | mai | jun | jul | aug | sep | okt | nov | des | 2014 |
| Blindern | -4,3 | +0,4 | +1,1 | +3,1 | +7,7 | +11,0 | +15,3 | +12,3 | +9,1 | +6,5 | +2,7 | -4,6 | |
| Voksenlia | -5,9 | -1,2 | +0,6 | +3,0 | +6,5 | +10,1 | +15,3 | +11,4 | +9,3 | +5,5 | +1,2 | -3,8 | +3,6 |
| Tryvannshøgda | -7,3 | -2,2 | -0,4 | +1,8 | +5,1 | +8,7 | +13,9 | +10,0 | +7,8 | +4,3 | +0,0 | -4,5 | |
| Midlere minimumstemp | jan | feb | mar | apr | mai | jun | jul | aug | sep | okt | nov | des | 2015 |
| Blindern | -2,9 | -2,2 | +0,4 | +2,1 | +2,6 | +9,5 | +11,9 | +11,8 | +9,1 | +4,2 | +0,6 | -0,5 | |
| Voksenlia | -3,2 | -2,6 | -0,6 | +1,8 | +3,8 | +8,5 | +10,7 | +11,7 | +8,7 | +4,4 | +0,5 | -0,8 | |
| Tryvannshøgda | -4,3 | -3,6 | -1,6 | +0,5 | +4,9 | +7,3 | +9,5 | +10,3 | +7,5 | +3,3 | -0,3 | -1,7 | |
| Midlere minimumstemp | jan | feb | mar | apr | mai | jun | jul | aug | sep | okt | nov | des | 2016 |
| Blindern | -7,6 | -3,7 | +0,1 | +2,3 | +7,6 | +12,3 | +13,0 | +11,9 | +11,4 | +3,7 | -1,4 | -1,5 | |
| Voksenlia | -7,6 | -3,7 | -0,2 | +1,5 | +6,8 | +11,1 | +12,0 | +10,9 | +10,8 | +2,7 | -2,1 | -1,2 | |
| Tryvannshøgda | -8,8 | -4,8 | -1,1 | +0,2 | +5,7 | +10,0 | +10,9 | +9,6 | - | - | -2,4 | -1,6 | |
| Midlere minimumstemp | jan | feb | mar | apr | mai | jun | jul | aug | sep | okt | nov | des | 2017 |
| Blindern | -3,7 | -3,6 | -0,7 | +1,0 | +7,2 | +10,9 | +12,8 | +11,5 | +10,1 | +4,0 | -0,9 | -3,8 | |
| Voksenlia | -3,6 | -4,6 | -1,3 | +0,3 | +6,4 | +9,5 | +11,6 | +10,5 | +8,6 | +3,8 | -1,2 | -3,3 | +3,1 |
| Tryvannshøgda | -3,9 | -5,4 | -2,4 | -0,7 | +5,5 | +8,3 | +10,4 | +9,3 | +7,3 | - | -2,2 | -4,0 | |
| Midlere minimumstemp | jan | feb | mar | apr | mai | jun | jul | aug | sep | okt | nov | des | 2018 |
| Blindern | -3,8 | -6,4 | -5,9 | +2,0 | +9,8 | +12,1 | +16,3 | 12,0 | +8,7 | +3,9 | +1,2 | -3,2 | +3,9 |
| Voksenlia | -4,5 | -7,6 | -6,4 | +1,6 | +10,2 | +11,2 | +15,2 | 11,3 | +8,0 | +3,7 | +0,2 | -3,2 | +3,4 |
| Tryvannshøgda | -5,2 | -8,4 | -7,6 | +0,4 | +9,4 | +10,2 | +14,1 | 10,1 | +6,9 | +2,4 | -0,4 | -3,9 | +2,3 |
| Midlere minimumstemp | jan | feb | mar | apr | mai | jun | jul | aug | sep | okt | nov | des | 2019 |
| Blindern | -5,3 | -2,1 | -1,2 | +3,1 | +6,0 | +10,8 | +13,5 | +13,2 | +8,0 | +2,9 | -0,2 | -1,6 | +3,9 |
| Voksenlia | -4,7 | -2,2 | -1,7 | +3,3 | +5,0 | +10,1 | +12,3 | +12,2 | +7,5 | +2,3 | -1,7 | -1,9 | +3,4 |
| Tryvasshøgda | -5,7 | -2,8 | -2,9 | +2,0 | +3,9 | +8,9 | +11,2 | +11,4 | +6,4 | +1,2 | -2,8 | -2,7 | +2,3 |
| Midlere minimumstemp | jan | feb | mar | apr | mai | jun | jul | aug | sep | okt | nov | des | 2020 |
| Blindern | +0,0 | -1,1 | | | | | | | | | | | |
| Voksenlia | +0,1 | -1,5 | | | | | | | | | | | |
| Tryvannshøgda | -1,1 | -2,7 | | | | | | | | | | | |
1) Mangelfulle data
Observasjoner for Tryvasshøgda og Blindern er henta fra DNMI.
Middeltemperaturene for Voksenlia så langt i 2004 og 2005 ligger nær de teoretiske temperaturene gitt som TV. Avviket er:
| jan | feb | mar | apr | mai | jun | jul | aug | sep | okt | nov | des | 2004 |
| +0,21) | -0,1 | 0,0 | +0,2 | +0,2 | +0,3 | +0,1 | +0,3 | +0,4 | +0,2 | +0,5 | +0,3 | +0,21) |
| jan | feb | mar | apr | mai | jun | jul | aug | sep | okt | nov | des | 2005 |
| +0,2 | +0,2 | +0,1 | +0,1 | 0,0 | 0,0 | +0,1 | +0,1 | +0,4 | 0,0 | +0,2 | +0,2 | -0,1 |
| jan | feb | mar | apr | mai | jun | jul | aug | sep | okt | nov | des | 2006 |
| +0,3 | +0,6 | +0,4 | -0,2 | -0,1 | -0,4 | -0,1 | -0,0 | +0,3 | -0,3 | +0,4 | +0,7 | +0,2 |
| jan | feb | mar | apr | mai | jun | jul | aug | sep | okt | nov | des | 2007 |
| +0,6 | +0,1 | +0,3 | 0,0 | -0,2 | 0,0 | -0,1 | 0,0 | -0,1 | +0,1 | +0,6 | -0,3 | |
| jan | feb | mar | apr | mai | jun | jul | aug | sep | okt | nov | des | 2008 |
| +0,1 | +0,3 | +0,3 | +0,3 | +0,4 | +0,0 | +0,1 | +0,3 | +0,3 | +0,6 | +0,6 | +0,3 | +0,3 |
| jan | feb | mar | apr | mai | jun | jul | aug | sep | okt | nov | des | 2009 |
| +0,1 | +0,5 | 0,0 | 0,0 | 0,0 | +0,1 | 0,0 | -0,1 | +0,3 | +0,3 | +0,2 | +0,4 | |
| jan | feb | mar | apr | mai | jun | jul | aug | sep | okt | nov | des | 2010 |
| +0,9 | +0,5 | +0,1 | +0,1 | 0,0 | 0,0 | -0,1 | +0,1 | +0,2 | +0,4 | +0,7 | +0,7 | |
| jan | feb | mar | apr | mai | jun | jul | aug | sep | okt | nov | des | 2011 |
| +0,7 | +0,4 | 0,0 | 0,0 | 0,0 | -0,1 | -0,1 | 0,0 | 0,0 | +0,4 | +0,1 | +0,5 | |
| jan | feb | mar | apr | mai | jun | jul | aug | sep | okt | nov | des | 2012 |
| +0,4 | +0,2 | +0,5 | +0,1 | +0,1 | -0,2 | -0,2 | -0,1 | +0,2 | +0,2 | +0,1 | +0,2 | |
| jan | feb | mar | apr | mai | jun | jul | aug | sep | okt | nov | des | 2013 |
| +0,3 | +0,3 | +0,4 | 0,0 | -0,3 | +0,2 | +0,1 | +0,2 | +0,5 | +0,3 | +0,5 | +0,2 | |
| jan | feb | mar | apr | mai | jun | jul | aug | sep | okt | nov | des | 2014 |
| +0,1 | -0,1 | +0,2 | +0,3 | -0,1 | +0,2 | +0,2 | +0,4 | +0,8 | +0,2 | +0,2 | +0,6 | |
| jan | feb | mar | apr | mai | jun | jul | aug | sep | okt | nov | des | 2015 |
| +0,5 | +0,2 | +0,4 | +0,2 | +0,3 | -0,1 | 0,0 | +0,2 | +0,5 | +0,5 | +0,3 | +0,3 | |
| jan | feb | mar | apr | mai | jun | jul | aug | sep | okt | nov | des | 2016 |
| +0,7 | +0,4 | +0,2 | +0,2 | 0,0 | +0,1 | 0,0 | +0,3 | +0,4 | - | - | +0.4 | |
| jan | feb | mar | apr | mai | jun | jul | aug | sep | okt | nov | des | 2017 |
| +0,4 | -0,2 | +0,1 | -0,1 | 0,0 | -0,3 | -0,0 | -0,1 | +0,2 | +0,3 | +0,4 | +0,5 | |
| jan | feb | mar | apr | mai | jun | jul | aug | sep | okt | nov | des | 2018 |
| +0,3 | -0,2 | -0,0 | -0,0 | +0,1 | -0,1 | -0,1 | +0,1 | +0,2 | +0,3 | +0,2 | +0,4 | +0,1 |
| jan | feb | mar | apr | mai | jun | jul | aug | sep | okt | nov | des | 2019 |
| +0,7 | +0,3 | +0,1 | +0,2 | +0,1 | -0,1 | +0,1 | -0,1 | -0,3 | -0,3 | +0,2 | +0,4 | +0,3 |
| jan | feb | mar | apr | mai | jun | jul | aug | sep | okt | nov | des | 2020 |
| +0,4 | +0,4 | | | | | | | | | | | |
1) Mangelfulle data
Merk at det ikke er sikkert at DNMI beregner middeltemepraturen på samme måte som jeg. Jeg beregner middeltemperaturen, uansett om det er et år, en måned eller en dag, som snittet av 5-minuttsmiddel.
Ut fra disse observasjonene kan jeg anslå normalen i perioden 1961-1990 for Voksenlia gitt DNMIs normaler for samme periode. Jeg har vekta Blindern og Tryvasshøgda som beskrevet over (TV), og lagt til 0,2. Denne justeringa er ment å ta hensyn til relativt milde netter i Voksenlia i klart vær.
| Normal 1961-1990 | jan | feb | mar | apr | mai | jun | jul | aug | sep | okt | nov | des | år |
| Blindern | -4,3 | -4,0 | -0,2 | +4,5 | +10,8 | +15,2 | +16,4 | +15,2 | +10,8 | +6,3 | +0,7 | -3,1 | +5,7 |
| Voksenlia | -4,8 | -4,5 | -1,2 | +2,9 | +9,1 | +13,5 | +14,7 | +13,6 | +9,4 | +5,2 | -0,3 | -3,5 | +4,5 |
| Tryvasshøgda | -5,4 | -5,1 | -2,1 | +1,6 | +7,6 | +12,2 | +13,3 | +12,3 | +8,2 | +4,1 | -1,3 | -4,1 | +3,4 |
Normaler for Tryvasshøgda og Blindern er henta fra DNMI.
Andre sammenlikninger med DNMIs målinger:
| Relativ fuktighet (%) | jan | feb | mar | apr | mai | jun | jul | aug | sep | okt | nov | des | 2004 |
| Blindern | 86 | 75 | 69 | 64 | 51 | 63 | 66 | 64 | 73 | 80 | 76 | 81 | 71 |
| Voksenlia | 911) | 80 | 78 | 71 | 59 | 68 | 73 | 70 | 76 | 89 | 82 | 84 | 771) |
| Tryvasshøgda | 93 | 78 | 78 | 76 | 61 | 74 | 79 | 76 | 80 | 90 | 84 | 84 | 80 |
| Relativ fuktighet (%) | jan | feb | mar | apr | mai | jun | jul | aug | sep | okt | nov | des | 2005 |
| Blindern | 74 | 68 | 69 | 59 | 65 | 57 | 61 | 69 | 73 | 81 | 79 | 81 | 70 |
| Voksenlia | 80 | 76 | 74 | 68 | 77 | 65 | 68 | 77 | 78 | 88 | 87 | 82 | 77 |
| Tryvasshøgda | 83 | 81 | 77 | 68 | 75 | 69 | 71 | 82 | 82 | 87 | 89 | 85 | 79 |
| Relativ fuktighet (%) | jan | feb | mar | apr | mai | jun | jul | aug | sep | okt | nov | des | 2006 |
| Blindern | 88 | 82 | 69 | 76 | 58 | 62 | 63 | 71 | 77 | 86 | 85 | 89 | 75 |
| Voksenlia | 87 | 81 | 71 | 80 | 61 | 67 | 67 | 76 | 84 | 91 | 83 | 82 | 77 |
| Tryvasshøgda | 90 | 82 | 73 | 81 | 64 | 68 | 70 | 79 | 85 | 91 | 87 | 83 | 79 |
| Relativ fuktighet (%) | jan | feb | mar | apr | mai | jun | jul | aug | sep | okt | nov | des | 2007 |
| Blindern | 79 | 80 | 70 | 57 | 65 | 59 | 73 | 68 | 69 | 78 | 75 | 88 | |
| Voksenlia | 81 | 88 | 73 | 61 | 72 | 63 | 82 | 74 | 74 | 83 | 78 | 91 | 77 |
| Tryvassshøgda | 83 | 88 | 76 | 62 | 73 | 65 | 82 | 76 | 76 | 81 | 79 | 86 | |
| Relativ fuktighet (%) | jan | feb | mar | apr | mai | jun | jul | aug | sep | okt | nov | des | 2008 |
| Blindern | 82 | 78 | 71 | 69 | 56 | 55 | 62 | 73 | 77 | 79 | 77 | 87 | 72 |
| Voksenlia | 87 | 82 | 77 | 75 | 56 | 61 | 66 | 83 | 85 | 84 | 79 | 90 | 77 |
| Tryvasshøgda | 88 | 83 | 81 | 78 | 60 | 63 | 68 | 82 | 85 | 84 | 81 | 88 | 78 |
| Relativ fuktighet (%) | jan | feb | mar | apr | mai | jun | jul | aug | sep | okt | nov | des | 2009 |
| Blindern | 84 | 85 | 74 | 70 | 60 | 53 | 73 | 75 | 71 | 76 | 86 | 86 | |
| Voksenlia | 86 | 90 | 82 | 74 | 63 | 55 | 80 | 81 | 75 | 82 | 95 | 92 | 80 |
| Tryvasshøgda | 85 | 87 | 82 | 73 | 66 | 60 | 81 | 82 | 76 | 81 | 94 | 90 | |
| Relativ fuktighet (%) | jan | feb | mar | apr | mai | jun | jul | aug | sep | okt | nov | des | 2010 |
| Blindern | 83 | 81 | 75 | 65 | 61 | 63 | 72 | 78 | 75 | 79 | 78 | 81 | |
| Voksenlia | 86 | 88 | 79 | 70 | 68 | 72 | 82 | 88 | 81 | 83 | 83 | 81 | 80 |
| Tryvasshøgda | 83 | 85 | 77 | 71 | 68 | 71 | 80 | 84 | 80 | 85 | 88 | 88 | |
| Relativ fuktighet (%) | jan | feb | mar | apr | mai | jun | jul | aug | sep | okt | nov | des | 2011 |
| Blindern | 85 | 82 | 69 | 64 | 65 | 71 | 73 | 77 | 82 | 81 | 88 | 82 | |
| Voksenlia | 80 | 84 | 70 | 65 | 68 | 76 | 77 | 82 | 86 | 85 | 90 | 84 | 79 |
| Tryvasshøgda | 84 | 88 | 73 | 67 | 73 | 80 | 82 | 85 | 86 | 86 | 90 | 89 | |
| Relativ fuktighet (%) | jan | feb | mar | apr | mai | jun | jul | aug | sep | okt | nov | des | 2012 |
| Blindern | 82 | 77 | 63 | 63 | 59 | 67 | 75 | 76 | 74 | 81 | 89 | 83 | |
| Voksenlia | 88 | 82 | 64 | 71 | 62 | 73 | 80 | 81 | 76 | 85 | 95 | 93 | 79 |
| Tryvasshøgda | 91 | 84 | 68 | 75 | 67 | 77 | 83 | 84 | 79 | 85 | 94 | 90 | |
| Relativ fuktighet (%) | jan | feb | mar | apr | mai | jun | jul | aug | sep | okt | nov | des | 2013 |
| Blindern | 84 | 82 | 57 | 57 | 70 | 70 | 62 | 75 | 76 | 83 | 82 | 84 | |
| Voksenlia | 91 | 84 | 59 | 67 | 76 | 74 | 63 | 76 | 76 | 85 | 84 | 88 | 77 |
| Tryvasshøgda | 84 | 88 | 60 | 68 | 78 | 78 | 68 | 80 | 80 | 86 | 82 | 87 | |
| Relativ fuktighet (%) | jan | feb | mar | apr | mai | jun | jul | aug | sep | okt | nov | des | 2014 |
| Blindern | 84 | 91 | 69 | 62 | 65 | 59 | 64 | 76 | 75 | 86 | 88 | 90 | |
| Voksenlia | 94 | 96 | 71 | 61 | 69 | 61 | 69 | 81 | 77 | 92 | 91 | 86 | |
| Tryvannshøgda | 93 | 95 | 72 | 64 | 72 | 66 | 69 | 85 | 80 | 94 | 96 | 86 | |
| Relativ fuktighet (%) | jan | feb | mar | apr | mai | jun | jul | aug | sep | okt | nov | des | 2015 |
| Blindern | 87 | 83 | 74 | 56 | 70 | 62 | 70 | 70 | 79 | 79 | 89 | 84 | |
| Voksenlia | 90 | 88 | 78 | 56 | 72 | 61 | 70 | 68 | 80 | 79 | 91 | 87 | 77 |
| Tryvannshøgda | 90 | 88 | 79 | 61 | 77 | 67 | 78 | 76 | 84 | 83 | 89 | 87 | |
| Relativ fuktighet (%) | jan | feb | mar | apr | mai | jun | jul | aug | sep | okt | nov | des | 2016 |
| Blindern | 83 | 79 | 79 | 69 | 63 | 63 | 73 | 75 | 78 | 75 | 83 | 85 | |
| Voksenlia | 90 | 82 | 83 | 74 | 66 | 66 | 76 | 77 | 78 | 79 | 87 | 84 | |
| Tryvannshøgda | 90 | 81 | 83 | 77 | 69 | 71 | 81 | 83 | 83 | 79 | 84 | 80 | |
| Relativ fuktighet (%) | jan | feb | mar | apr | mai | jun | jul | aug | sep | okt | nov | des | 2017 |
| Blindern | 87 | 85 | 73 | 65 | 68 | 68 | 66 | 79 | 84 | 79 | 84 | 86 | |
| Voksenlia | 85 | 91 | 78 | 69 | 72 | 73 | 68 | 78 | 84 | 79 | 87 | 83 | 80 |
| Tryvannshøgda | 81 | 86 | 75 | 68 | 70 | 71 | 71 | 82 | 88 | 79 | 86 | 86 | |
| Relativ fuktighet (%) | jan | feb | mar | apr | mai | jun | jul | aug | sep | okt | nov | des | 2018 |
| Blindern | 89 | 80 | 66 | 63 | 57 | 55 | 55 | 69 | 72 | 76 | 88 | 85 | 71 |
| Voksenlia | 92 | 92 | 73 | 67 | 57 | 55 | 54 | 71 | 75 | 80 | 95 | 92 | 75 |
| Tryvannshøgda | 88 | 90 | 70 | 67 | 57 | 58 | 58 | 75 | 77 | 81 | 92 | 87 | 75 |
| Relativ fuktighet (%) | jan | feb | mar | apr | mai | jun | jul | aug | sep | okt | nov | des | 2019 |
| Blindern | 76 | 83 | 69 | 45 | 65 | 71 | 66 | 79 | 76 | 84 | 86 | 92 | 74 |
| Voksenlia | 80 | 88 | 78 | 51 | 68 | 75 | 65 | 80 | 77 | 87 | 93 | 93 | 78 |
| Tryvannshøgda | 77 | 83 | 76 | 53 | 69 | 77 | 70 | 84 | 79 | 88 | 94 | 92 | 78 |
| Relativ fuktighet (%) | jan | feb | mar | apr | mai | jun | jul | aug | sep | okt | nov | des | 2020 |
| Blindern | 84 | 75 | | | | | | | | | | | |
| Voksenlia | 85 | 80 | | | | | | | | | | | |
| Tryvannshøgda | 84 | 79 | | | | | | | | | | | |
| Nedbør (mm) | jan | feb | mar | apr | mai | jun | jul | aug | sep | okt | nov | des | 2004 |
| Blindern | 109 | 25 | 36 | 54 | 40 | 75 | 52 | 81 | 106 | 97 | 47 | 33 | 756 |
| Voksenlia2) | - | - | - | - | 40 | 124 | 72 | 873) | 131 | 133 | 51 | 46 | 9161) |
| Tryvasshøgda | 116 | 24 | 54 | 82 | 46 | 125 | 76 | 118 | 145 | 149 | 72 | 85 | 1071 |
| Nedbør (mm) | jan | feb | mar | apr | mai | jun | jul | aug | sep | okt | nov | des | 2005 |
| Blindern | 36 | 10 | 25 | 30 | 99 | 41 | 79 | 104 | 39 | 100 | 116 | 39 | 705 |
| Voksenlia | 39 | 16 | 25 | 45 | 137 | 53 | 110 | 146 | 44 | 132 | 141 | 33 | 921 |
| Tryvasshøgda | 55 | 27 | 44 | 50 | 134 | 57 | 100 | 168 | 47 | 159 | 193 | 48 | 1082 |
| Nedbør (mm) | jan | feb | mar | apr | mai | jun | jul | aug | sep | okt | nov | des | 2006 |
| Blindern | 40 | 64 | 50 | 53 | 80 | 58 | 37 | 113 | 57 | 163 | 150 | 68 | 930 |
| Voksenlia | 42 | 48 | 20 | 50 | 82 | 60 | 58 | 146 | 76 | 165 | 171 | 77 | 996 |
| Tryvasshøgda | 64 | 83 | 52 | 93 | 108 | 72 | 66 | 158 | 82 | 185 | 219 | 106 | 1288 |
| Nedbør (mm) | jan | feb | mar | apr | mai | jun | jul | aug | sep | okt | nov | des | 2007 |
| Blindern | 71 | 40 | 29 | 49 | 87 | 133 | 185 | 61 | 65 | 17 | 88 | 48 | |
| Voksenlia | 100 | 42 | 43 | 42 | 99 | 185 | 192 | 88 | 75 | 29 | 96 | 87 | 1076 |
| Tryvasshøgda | 97 | 67 | 53 | 62 | 118 | 204 | 215 | 136 | 85 | 38 | 108 | 121 | |
| Nedbør (mm) | jan | feb | mar | apr | mai | jun | jul | aug | sep | okt | nov | des | 2008 |
| Blindern | 107 | 77 | 76 | 67 | 21 | 51 | 149 | 180 | 45 | 130 | 71 | 56 | 1014 |
| Voksenlia | 168 | 81 | 102 | 69 | 29 | 66 | 166 | 191 | 57 | 142 | 74 | 65 | 1204 |
| Tryvasshøgda | 196 | 92 | 125 | 80 | 34 | 71 | 194 | 197 | 73 | 166 | 86 | 72 | 1387 |
| Nedbør (mm) | jan | feb | mar | apr | mai | jun | jul | aug | sep | okt | nov | des | 2009 |
| Blindern | 58 | 69 | 58 | 55 | 75 | 32 | 162 | 148 | 41 | 55 | 125 | 68 | |
| Voksenlia | 89 | 62 | 57 | 50 | 71 | 55 | 181 | 176 | 33 | 73 | 159 | 73 | 1078 |
| Tryvasshøgda | 84 | 82 | 81 | 61 | 76 | 44 | 215 | 210 | 33 | 87 | 217 | 85 | |
| Nedbør (mm) | jan | feb | mar | apr | mai | jun | jul | aug | sep | okt | nov | des | 2010 |
| Blindern | 14 | 37 | 38 | 58 | 54 | 78 | 117 | 158 | 89 | 84 | 24 | 15 | |
| Voksenlia | 10 | 18 | 31 | 52 | 44 | 80 | 153 | 191 | 116 | 128 | 34 | 10 | 867 |
| Tryvasshøgda | 30 | 39 | 40 | 66 | 52 | 81 | 155 | 187 | 134 | 143 | 52 | 18 | |
| Nedbør (mm) | jan | feb | mar | apr | mai | jun | jul | aug | sep | okt | nov | des | 2011 |
| Blindern | 47 | 53 | 18 | 40 | 68 | 157 | 107 | 189 | 150 | 75 | 21 | 70 | |
| Voksenlia | 59 | 44 | 19 | 35 | 76 | 146 | 132 | 211 | 161 | 81 | 30 | 83 | 1077 |
| Tryvasshøgda | 74 | 75 | 27 | 36 | 78 | 163 | 146 | 251 | 188 | 91 | 35 | 122 | |
| Nedbør (mm) | jan | feb | mar | apr | mai | jun | jul | aug | sep | okt | nov | des | 2012 |
| Blindern | 54 | 14 | 18 | 70 | 59 | 94 | 149 | 98 | 84 | 116 | 150 | 74 | |
| Voksenlia | 48 | 12 | 19 | 109 | 68 | 135 | 152 | 131 | 104 | 129 | 186 | 55 | 1150 |
| Tryvannshøgda | 68 | 27 | 31 | 135 | 70 | 134 | 152 | 132 | 112 | 144 | 220 | 98 | |
| Nedbør (mm) | jan | feb | mar | apr | mai | jun | jul | aug | sep | okt | nov | des | 2013 |
| Blindern | 42 | 18 | 9 | 41 | 89 | 127 | 19 | 121 | 41 | 92 | 53 | 108 | |
| Voksenlia | 42 | 14 | 9 | 57 | 138 | 174 | 24 | 122 | 76 | 123 | 55 | 114 | 939 |
| Tryvannshøgda | 61 | 25 | 13 | 78 | 132 | 179 | 29 | 115 | 72 | 129 | 64 | 154 | |
| Nedbør (mm) | jan | feb | mar | apr | mai | jun | jul | aug | sep | okt | nov | des | 2014 |
| Blindern | 73 | 130 | 58 | 55 | 57 | 111 | 53 | 109 | 42 | 211 | 102 | 28 | |
| Voksenlia | 82 | 166 | 67 | 65 | 63 | 57 | 78 | 206 | 49 | 247 | 126 | 20 | |
| Tryvannshøgda | 99 | 232 | 100 | 78 | 66 | 64 | 67 | 182 | 41 | 281 | 184 | 42 | |
| Nedbør (mm) | jan | feb | mar | apr | mai | jun | jul | aug | sep | okt | nov | des | 2015 |
| Blindern | 111 | 28 | 62 | 17 | 107 | 69 | 89 | 131 | 158 | 8 | 76 | 57 | |
| Voksenlia | 69 | 31 | 53 | 25 | 163 | 106 | 122 | 156 | 236 | 14 | 85 | 63 | 1122 |
| Tryvannshøgda | 214 | 77 | 86 | 21 | 156 | 84 | 110 | 159 | 243 | 17 | 112 | 103 | |
| Nedbør (mm) | jan | feb | mar | apr | mai | jun | jul | aug | sep | okt | nov | des | 2016 |
| Blindern | 43 | 50 | 47 | 77 | 74 | 61 | 85 | 144 | 41 | 13 | 74 | 20 | |
| Voksenlia | 14 | 58 | 60 | 85 | 117 | 89 | 132 | 238 | 44 | 38 | 98 | 27 | |
| Tryvannshøgda | 54 | 92 | 71 | 91 | 116 | 94 | 126 | 214 | - | - | - | - | |
| Nedbør (mm) | jan | feb | mar | apr | mai | jun | jul | aug | sep | okt | nov | des | 2017 |
| Blindern | 26 | 55 | 41 | 57 | 78 | 91 | 98 | 159 | 100 | 111 | 78 | 48 | |
| Voksenlia | 38 | 48 | 58 | 74 | 109 | 125 | 138 | 286 | 151 | 163 | 82 | 42 | 1314 |
| Tryvannshøgda | - | - | - | - | - | - | 117 | 297 | 173 | 170 | 110 | 80 | |
| Nedbør (mm) | jan | feb | mar | apr | mai | jun | jul | aug | sep | okt | nov | des | 2018 |
| Blindern | 86 | 54 | 14 | 36 | 28 | 39 | 16 | 57 | 125 | 39 | 101 | 63 | 567 |
| Voksenlia | 75 | 43 | 7 | 47 | 40 | 50 | 27 | 77 | 157 | 52 | 162 | 56 | 795 |
| Tryvannshøgda | 151 | 102 | 30 | 45 | 32 | 56 | 22 | 68 | 167 | 66 | 192 | 107 | 1038 |
| Nedbør (mm) | jan | feb | mar | apr | mai | jun | jul | aug | sep | okt | nov | des | 2019 |
| Blindern | 24 | 81 | 73 | 11 | 83 | 125 | 58 | 127 | 169 | 110 | 112 | 57 | 1043 |
| Voksenlia | 6 | 38 | 75 | 23 | 112 | 136 | 90 | 192 | 185 | 151 | 109 | 72 | 1170 |
| Tryvannshøgda | 43 | 116 | 122 | 18 | 117 | 122 | 69 | 187 | 191 | 153 | 110 | 76 | 1432 |
| Nedbør (mm) | jan | feb | mar | apr | mai | jun | jul | aug | sep | okt | nov | des | 2020 |
| Blindern | 75 | 34 | | | | | | | | | | | |
| Voksenlia | 107 | 49 | | | | | | | | | | | |
| Tryvannshøgda | 127 | 80 | | | | | | | | | | | |
1) Mangelfulle (estimerte) data
2) Ingen nedbørsdata før 2004-04-30
3) Unøyaktig målinger (estimerte) fra siste dager i august pga edderkoppkoloni i nedbørsmåler!
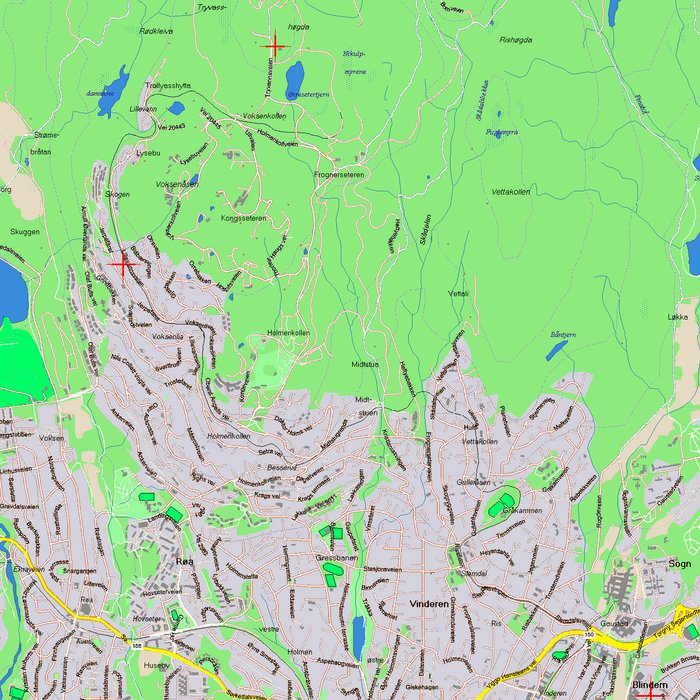
Områdekart
Kartet under viser med røde kryss posisjonene til Voksenlia (lengst vest), Tryvannshøgda og Blindern (lengst øst). Kartutsnittet er på ca. 5 × 5 km. Nord er opp.
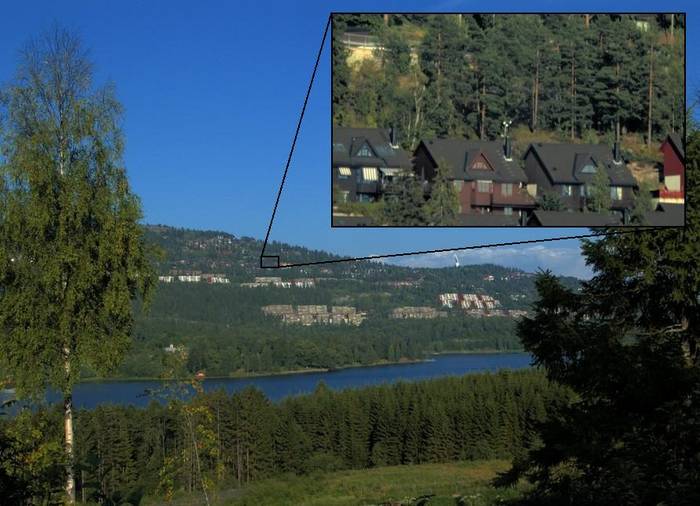
Beliggenhet
Bildet under viser belliggenheten. Det er tatt fra Bærumsmarka mot Oslo over Bogstadvannet. Tårnet i Holmenkollbakken kan ses i høgre del av bildet. Værstasjonen kan skimtes midt i bildeutsnittet.
Send e-post til steinar@latinitas.org (Steinar Midtskogen) om du har spørsmål om denne sida.